Student / community
LCSP Infrastructure Monitoring with Zabbix
Monitoring the lab with Zabbix — Proxmox cluster, Windows and Linux servers, alerting — with Active Directory authentication over LDAPS.
My contribution
I designed and deployed the lab's Zabbix monitoring infrastructure: an architecture split across several LXC containers, a PostgreSQL / TimescaleDB database, Proxmox, Windows and Linux service integration, dashboards, agent discovery and auto-registration, PSK and LDAPS security, and custom templates and thresholds.
Highlights
- Active Directory authentication over LDAPS, roles assigned from groups
- Automatic agent registration and classification, PSK-encrypted communication
- Important alerts forwarded to Discord
Goal
Provide an overview of the state of the lab’s infrastructure: service availability, latency, history, and alerts that quickly show what has stopped working.
Architecture
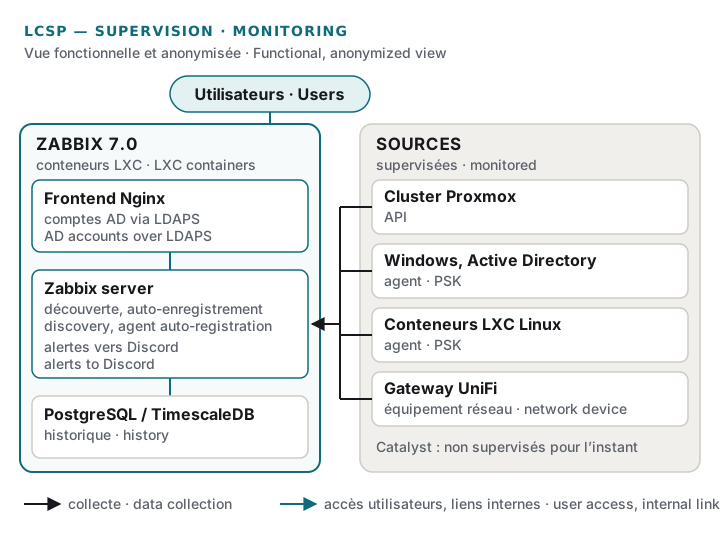
Zabbix 7.0 runs on Debian 13, with an Nginx frontend and a PostgreSQL / TimescaleDB database. The components are spread across several LXC containers rather than packed into a single machine.
What is monitored
- The Proxmox cluster, through its API.
- Active Directory and the Windows servers, through agents.
- Linux services and containers, through agents.
- The UniFi gateway.
The Catalyst switches are not monitored yet.
How it works
- Custom dashboards and an infrastructure-wide overview.
- Automatic discovery; new agents register themselves and are classified automatically from their metadata.
- Agent communication encrypted with PSK.
- Custom templates and thresholds, including a template dedicated to PostgreSQL / TimescaleDB storage.
- Important alerts forwarded to a Discord group.
Authentication
Users sign in with their Active Directory credentials, checked over LDAPS with certificate chain validation. This is not single sign-on (SSO): credentials are entered in Zabbix, which then assigns roles based on the user’s Active Directory groups.