Professional
PostgreSQL / TimescaleDB monitoring with Zabbix
Designed a Zabbix 7.0 template for PostgreSQL and TimescaleDB storage monitoring: a Python collector discovers databases, tables and hypertables, with installation and preflight scripts.
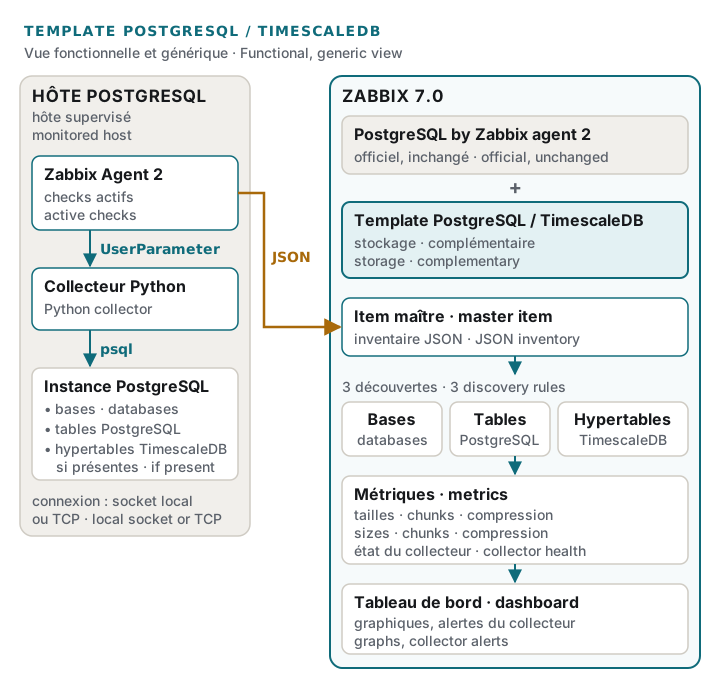
Project carried out in a professional setting: the description is deliberately generalized.
My contribution
Designed and developed the template and its collector: database, table and hypertable discovery, table, index and TOAST size metrics, and chunk, compression and collection health monitoring. Built the installation, preflight and uninstall scripts, and offline tests. Support for both local Unix-socket peer authentication and TCP connections.
Highlights
- Automatic discovery of PostgreSQL databases, tables and TimescaleDB hypertables
- Table, index, TOAST and total sizes; chunks and compression
- Python collector run by Zabbix Agent 2, one JSON document per cycle
- Installation, preflight and uninstall scripts
- Supports local Unix-socket peer authentication and TCP
Context
A PostgreSQL database that stores time series grows continuously, and most of that volume sits in a handful of tables. With TimescaleDB, those tables are hypertables, split into chunks. Knowing that the disk is filling up is not enough: you need to see which tables are growing, and how fast.
Goal
Get table-level storage monitoring in Zabbix that can be reused from one database to the next, with no manual per-table configuration, alongside the official PostgreSQL by Zabbix agent 2 template, which stays unchanged.
How it works
- Collection. Zabbix Agent 2 runs a Python collector through a UserParameter; the collector
queries the instance with
psqland returns a single JSON document on each cycle. - Discovery. Three discovery rules build on that document: databases, PostgreSQL tables and TimescaleDB hypertables. No database or table name is hard-coded.
- Storage metrics. For each discovered table: table, index, TOAST, other and total sizes. For hypertables: number of chunks, compressed and uncompressed chunks, and whether compression is enabled.
- Collection health. Duration, errors and warnings, partial collection, unreachable databases. Alerts cover this collection health; the template’s macros set, among other things, the discovery filters and the collection interval.
- Dashboard. “PostgreSQL / TimescaleDB storage” groups the graphs by database, table and hypertable, the chunks and the collector’s state.
- Installation. Installation, preflight and uninstall scripts — the preflight checks the installation, the connection mode and the collector’s execution before deployment — along with offline tests.
- Two connection modes. Local Unix socket with peer authentication, or a TCP connection.
Result
A working template for Zabbix 7.0, shipped as version 1.1.0 with its installation, preflight and uninstall scripts and offline tests. It supports both local Unix-socket peer authentication and TCP connections.